+11.17% Wheeling BORING Names YTD. Here Are the Details.
I’m up 11.17% on deployed capital, $9,073 in net P/L on a $147K account. My median weekly deployed capital is only $81,200. 1/2 of my money has been sitting in cash earning 4%+ in money market.
I’m not trying to beat the market on raw returns. I’m generating consistent income while keeping a big chunk of my money on the sidelines, ready to deploy when the everyone is in shambles. And when things eventually do get ugly (they always do), I won’t be fully invested at the top. Do yourself a favor and ask those who chase juicy premiums what their max drawdown was this year. 30%? 45%? Higher?
This post is a full breakdown of the YTD performance of the BORING PUTS strategy through May 31, 2026. Every trade, every number, every ticker. The full trade log is downloadable at the bottom if you want to verify anything.
If you’ve been following me for a while, you already know… but if not, I just sell CSP’s on boring, profitable companies. Get assigned sometimes. Sell covered calls when you do. Sometimes collect premium and dividends while you wait. That’s it.
No 0 DTE /r/wallstreetbets highlights, no meme’s, no 3x leveraged ETF’s, no fat premium juicers. Just large-cap names with ER beats, strong balance sheets, and liquid options chains. I don’t stress assignments because when those happen, I’m just holding shares of a good business and sometimes getting paid to wait.
| Metric | Value |
|---|---|
| Net P/L | $9,073.50 (+11.17%) |
| Realized Income | $8,451.20 |
| Premiums | $6,100.88 |
| Stock P/L | $1,100.00 |
| Interest | $955.32 |
| Dividends | $295.00 |
| Trades | 106 |
| Sharpe Ratio | 1.26 |
| Sortino Ratio | 1.94 |
| Max Drawdown | -9.92% |
| Annualized Yield | 27.6% |
| Avg Weekly ROC | 0.53% |
| Avg Per-Trade ROC | 0.46% |
| Median Weekly Deployed | $81,200 |
| Capital Deployed | $41,670 (28%) |
| Current Cash | $105,379 (72%) |
| Total Capital | $147,049 |
| SPY Return | +10.93% |
| SPY Annualized | +26.96% |
| SPY Max Drawdown | -9.32% |
The +11.17% return is on median deployed capital of $81,200 plus dividends & interest, not on the full $147K account.
When the market was in shambles (Hormuz, TACO, etc.), I wasn’t sweating a fully invested portfolio. I was sitting in a decent amount of cash earning 4%+ in money market while waiting.
The max drawdown of -9.92% happened during the QCOM saga. I got assigned at $167.50 and $160, watched it drop to $124, and sat through $7,900 in unrealized losses before eventually wheeling out with $2,900 in profit. Wrote a full breakdown of that trade here. That was the hardest stretch so far, but it’s also the best proof of concept. The wheel works if you trust the business and stay patient.
Look at the YTD ticker list. These aren’t speculative names and they won’t offer juicy premiums:
YTD Top Symbols by P/L:
| Ticker | Net P/L |
|---|---|
| QCOM | $2,889 |
| LRCX | $988 |
| NVDA | $791 |
| GOOG | $654 |
| DG | $559 |
| HPE | $272 |
| NEE | $212 |
| AA | $209 |
| DAL | $191 |
QCOM was the biggest YTD earner at $2,889. Most of that came from the full wheel completing itself. I was underwater for months, grinding CC premium week after week, sometimes earning pennies, collecting dividends, and in late April it finally ripped through my strikes and I got called away above cost on both lots. A long, boring grind that paid off. RIP to those selling CC’s under their cost basis. That’s the risk you take when doing that.
LRCX has been the other standout at $988. The first trade I bought back next day for a quick $225. The second is a $260 put still open, sitting at +$763 in premium.
NVDA is at $791 YTD. A lot of that was CC management on assigned shares. Some of those individual CC trades had to be rolled (after the stock ripped), but the net across all NVDA activity this year is still solidly positive.
I see posts every week from people asking “what should I sell puts on?” and the top answers are always stuff like SOFI, HIMS, MARA, RIOT, IONQ, or whatever WSB and X is pumping that week.
Those names offer fat premiums. But the premium is fat for a reason. The market is telling you this thing could move 15% in either direction next week. And when it does, you’re stuck with shares of a company that might not even be profitable, trading at 200x revenue, with a questionable balance sheet.
The people wheeling high-beta junk collected fat premium in January and then spent the next four months bagholding through a 30-40% drawdown (or buying back at a large loss) on names that don’t recover the way a QCOM or NVDA does.
Meanwhile I’m sitting here with QCOM, NVDA, GOOG, WMT, XOM on my trade log. Companies that recover. Companies that pay dividends while you wait. Companies where the wheel actually works because the business isn’t broken when the stock is down.
This might be the most important part of the whole strategy. There were multiple stretches this year where I did almost nothing. Zero new positions. Just sat on my hands and waited.
When breadth is bad, I don’t open new risk. The hardest part of selling premium isn’t picking the right strike. It’s knowing when to not sell at all.
Look at the monthly trade counts YTD:
| Month | Trades | Net P/L |
|---|---|---|
| January | 43 | $2,099 |
| February | 13 | $1,575 |
| March | 27 | $489 |
| April | 13 | $1,046 |
| May | 10 | $1,526 |
January was busy, the market was cooperating and I was actively managing QCOM and NVDA positions. February I pulled way back to 13 trades. March had 27 trades but most were small CC management on existing positions, grinding $20-$50 per round. April, 13 trades again. May, only 10 trades in the entire month.
As of May 31:
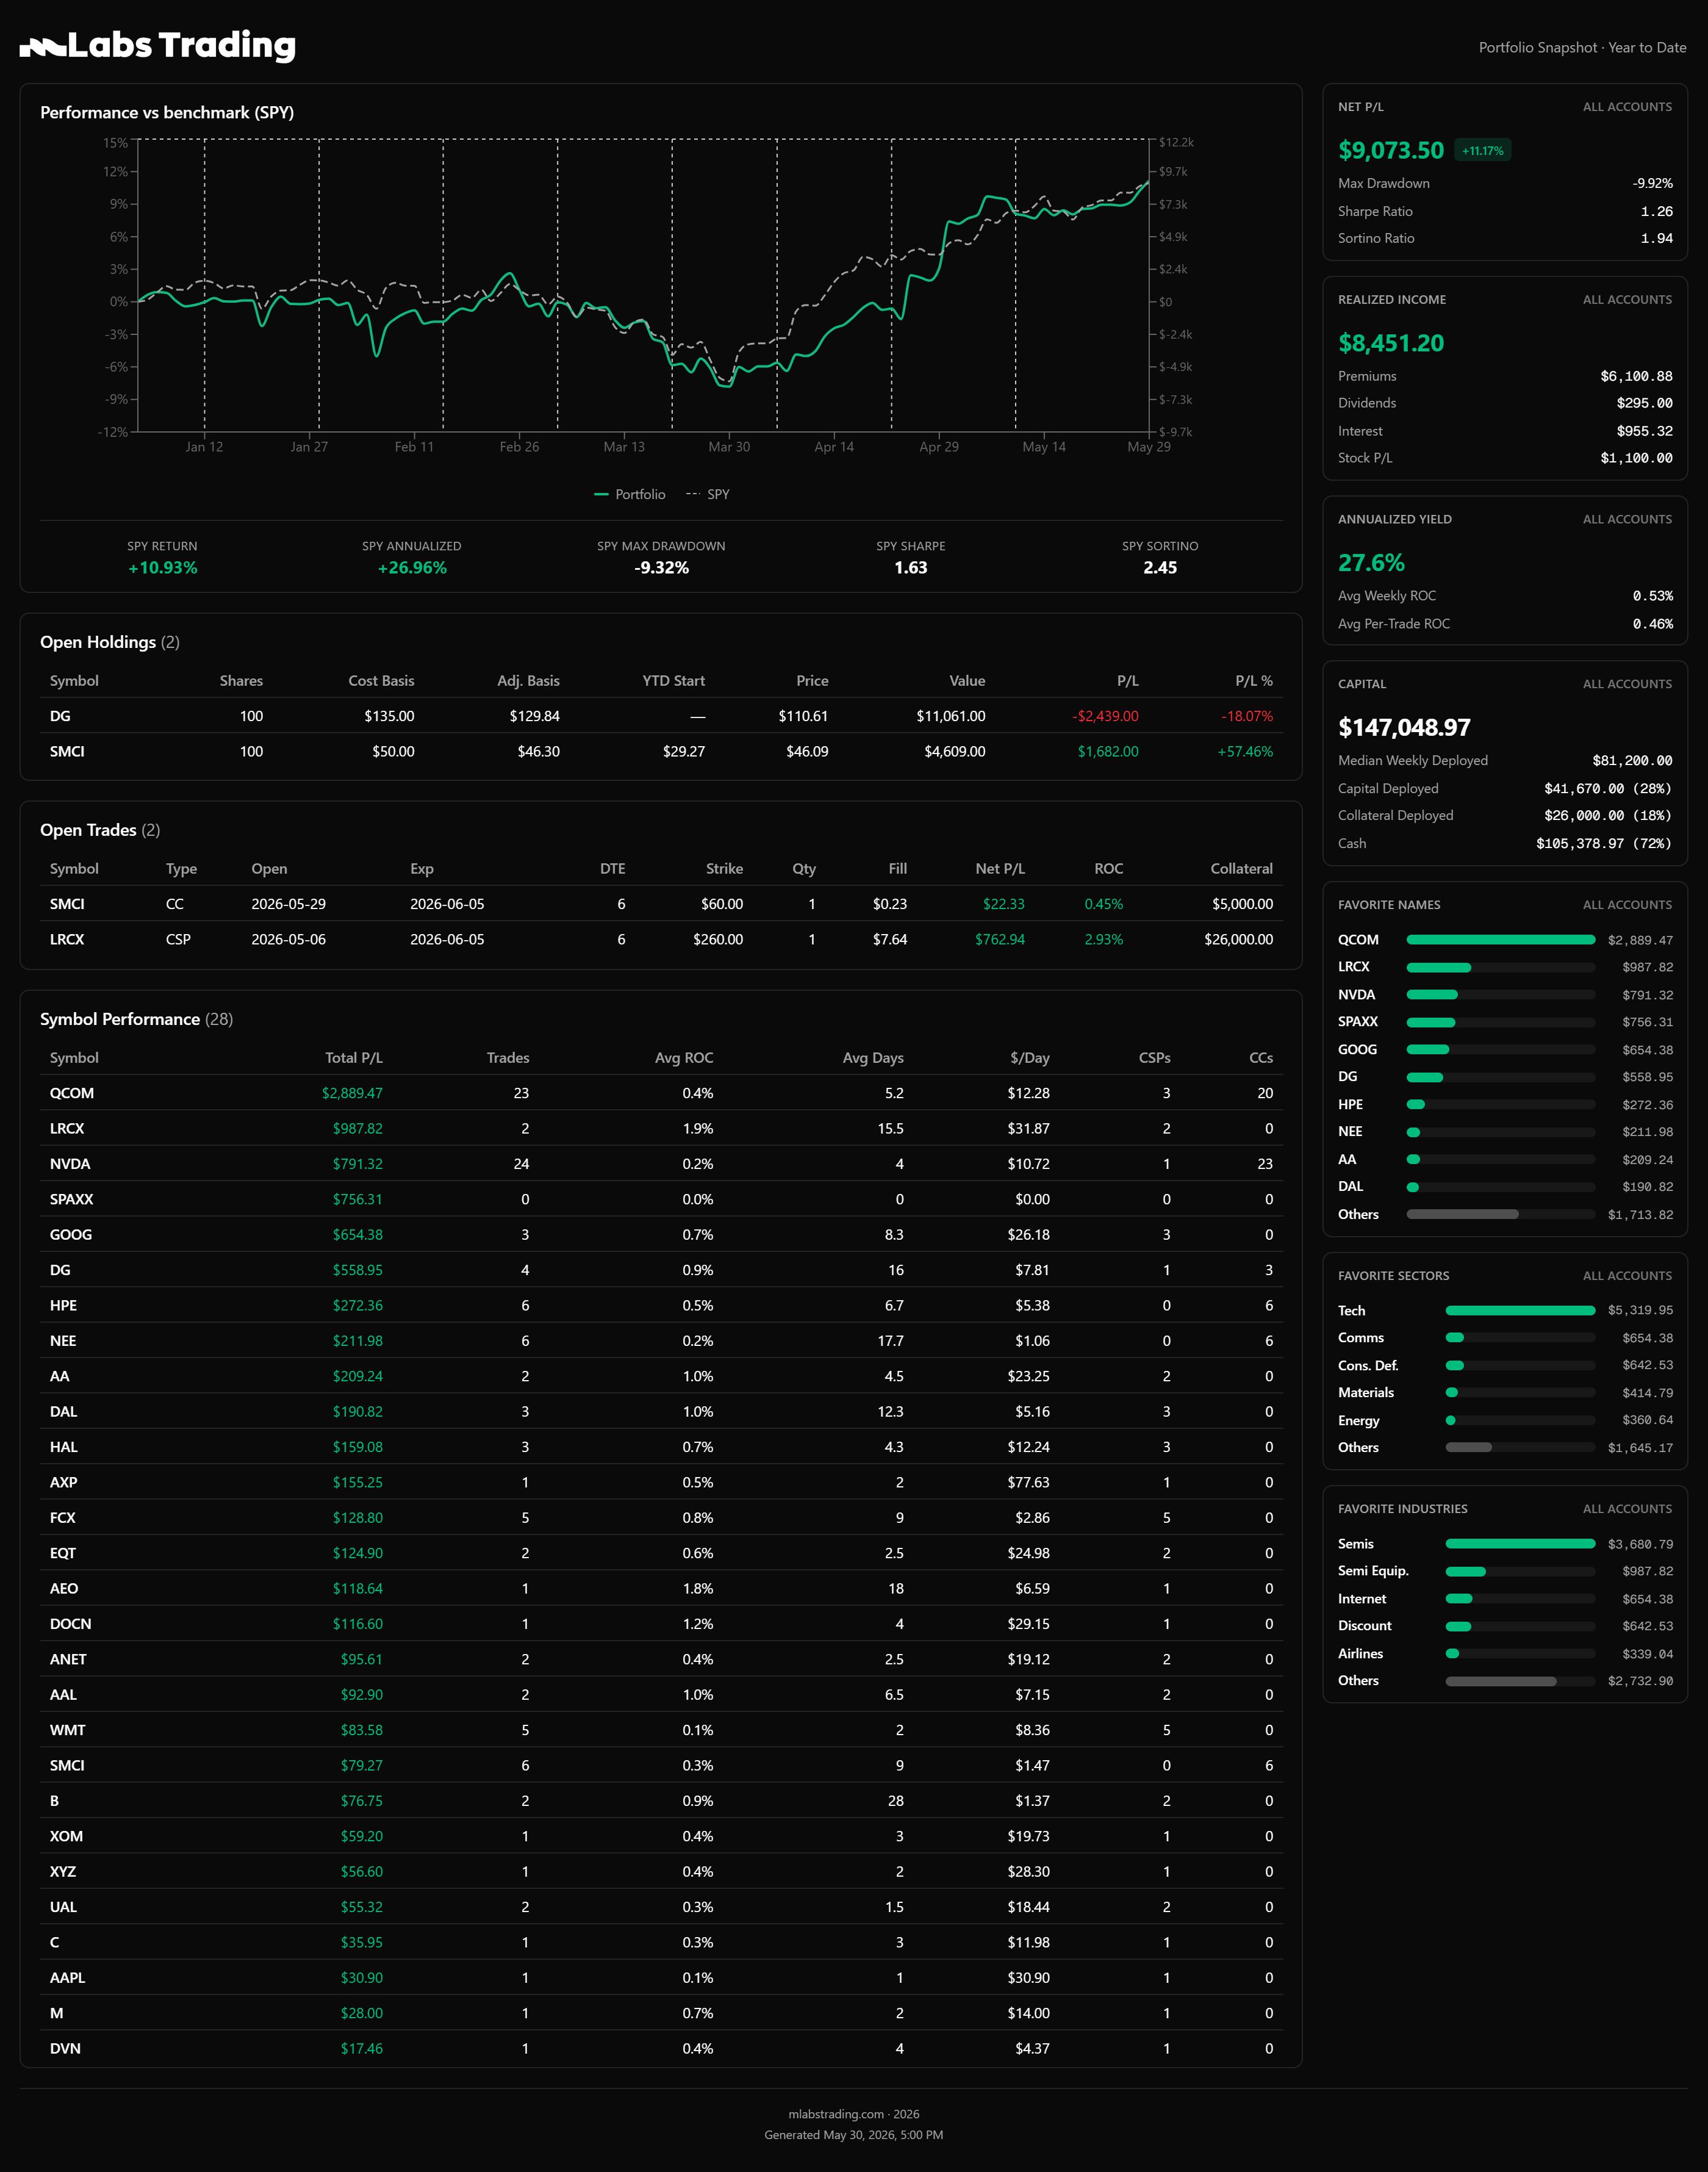
YTD portfolio snapshot through May 30, 2026 — click to enlarge
For context, this strategy has been running since June 16, 2025. Here’s the inception-to-date snapshot:
| Metric | Value |
|---|---|
| Net P/L | $28,687.39 (+35.33%) |
| Realized Income | $30,798.76 |
| Premiums | $22,216.39 |
| Stock P/L | $5,000.00 |
| Interest | $2,547.76 |
| Dividends | $1,034.61 |
| Total Trades | 268 |
| Unique Tickers | 45 |
| Win Rate | 96.2% |
| Sharpe Ratio | 2.13 |
| Sortino Ratio | 3.41 |
| Max Drawdown | -9.93% |
| Annualized Yield | 37.2% |
| Avg Weekly ROC | 0.71% |
| Avg Per-Trade ROC | 0.54% |
| SPY Return (same period) | +25.52% |
| SPY Annualized | +26.84% |
| SPY Max Drawdown | -10.54% |
| SPY Sharpe | 1.64 |
| SPY Sortino | 2.40 |
A Sharpe above 2 over 11 months is the number I care about the most. It means the returns aren’t coming from wild swings or getting lucky on a couple huge trades. It’s consistent, boring, repeatable income. The portfolio is up 35.33% since inception vs SPY’s 25.52%, with a higher Sharpe (2.13 vs 1.64) and a shallower max drawdown (-9.93% vs -10.54%). And it did that with most of the capital sitting in cash the entire time. That’s the real edge. Better returns, less risk, fraction of the exposure.
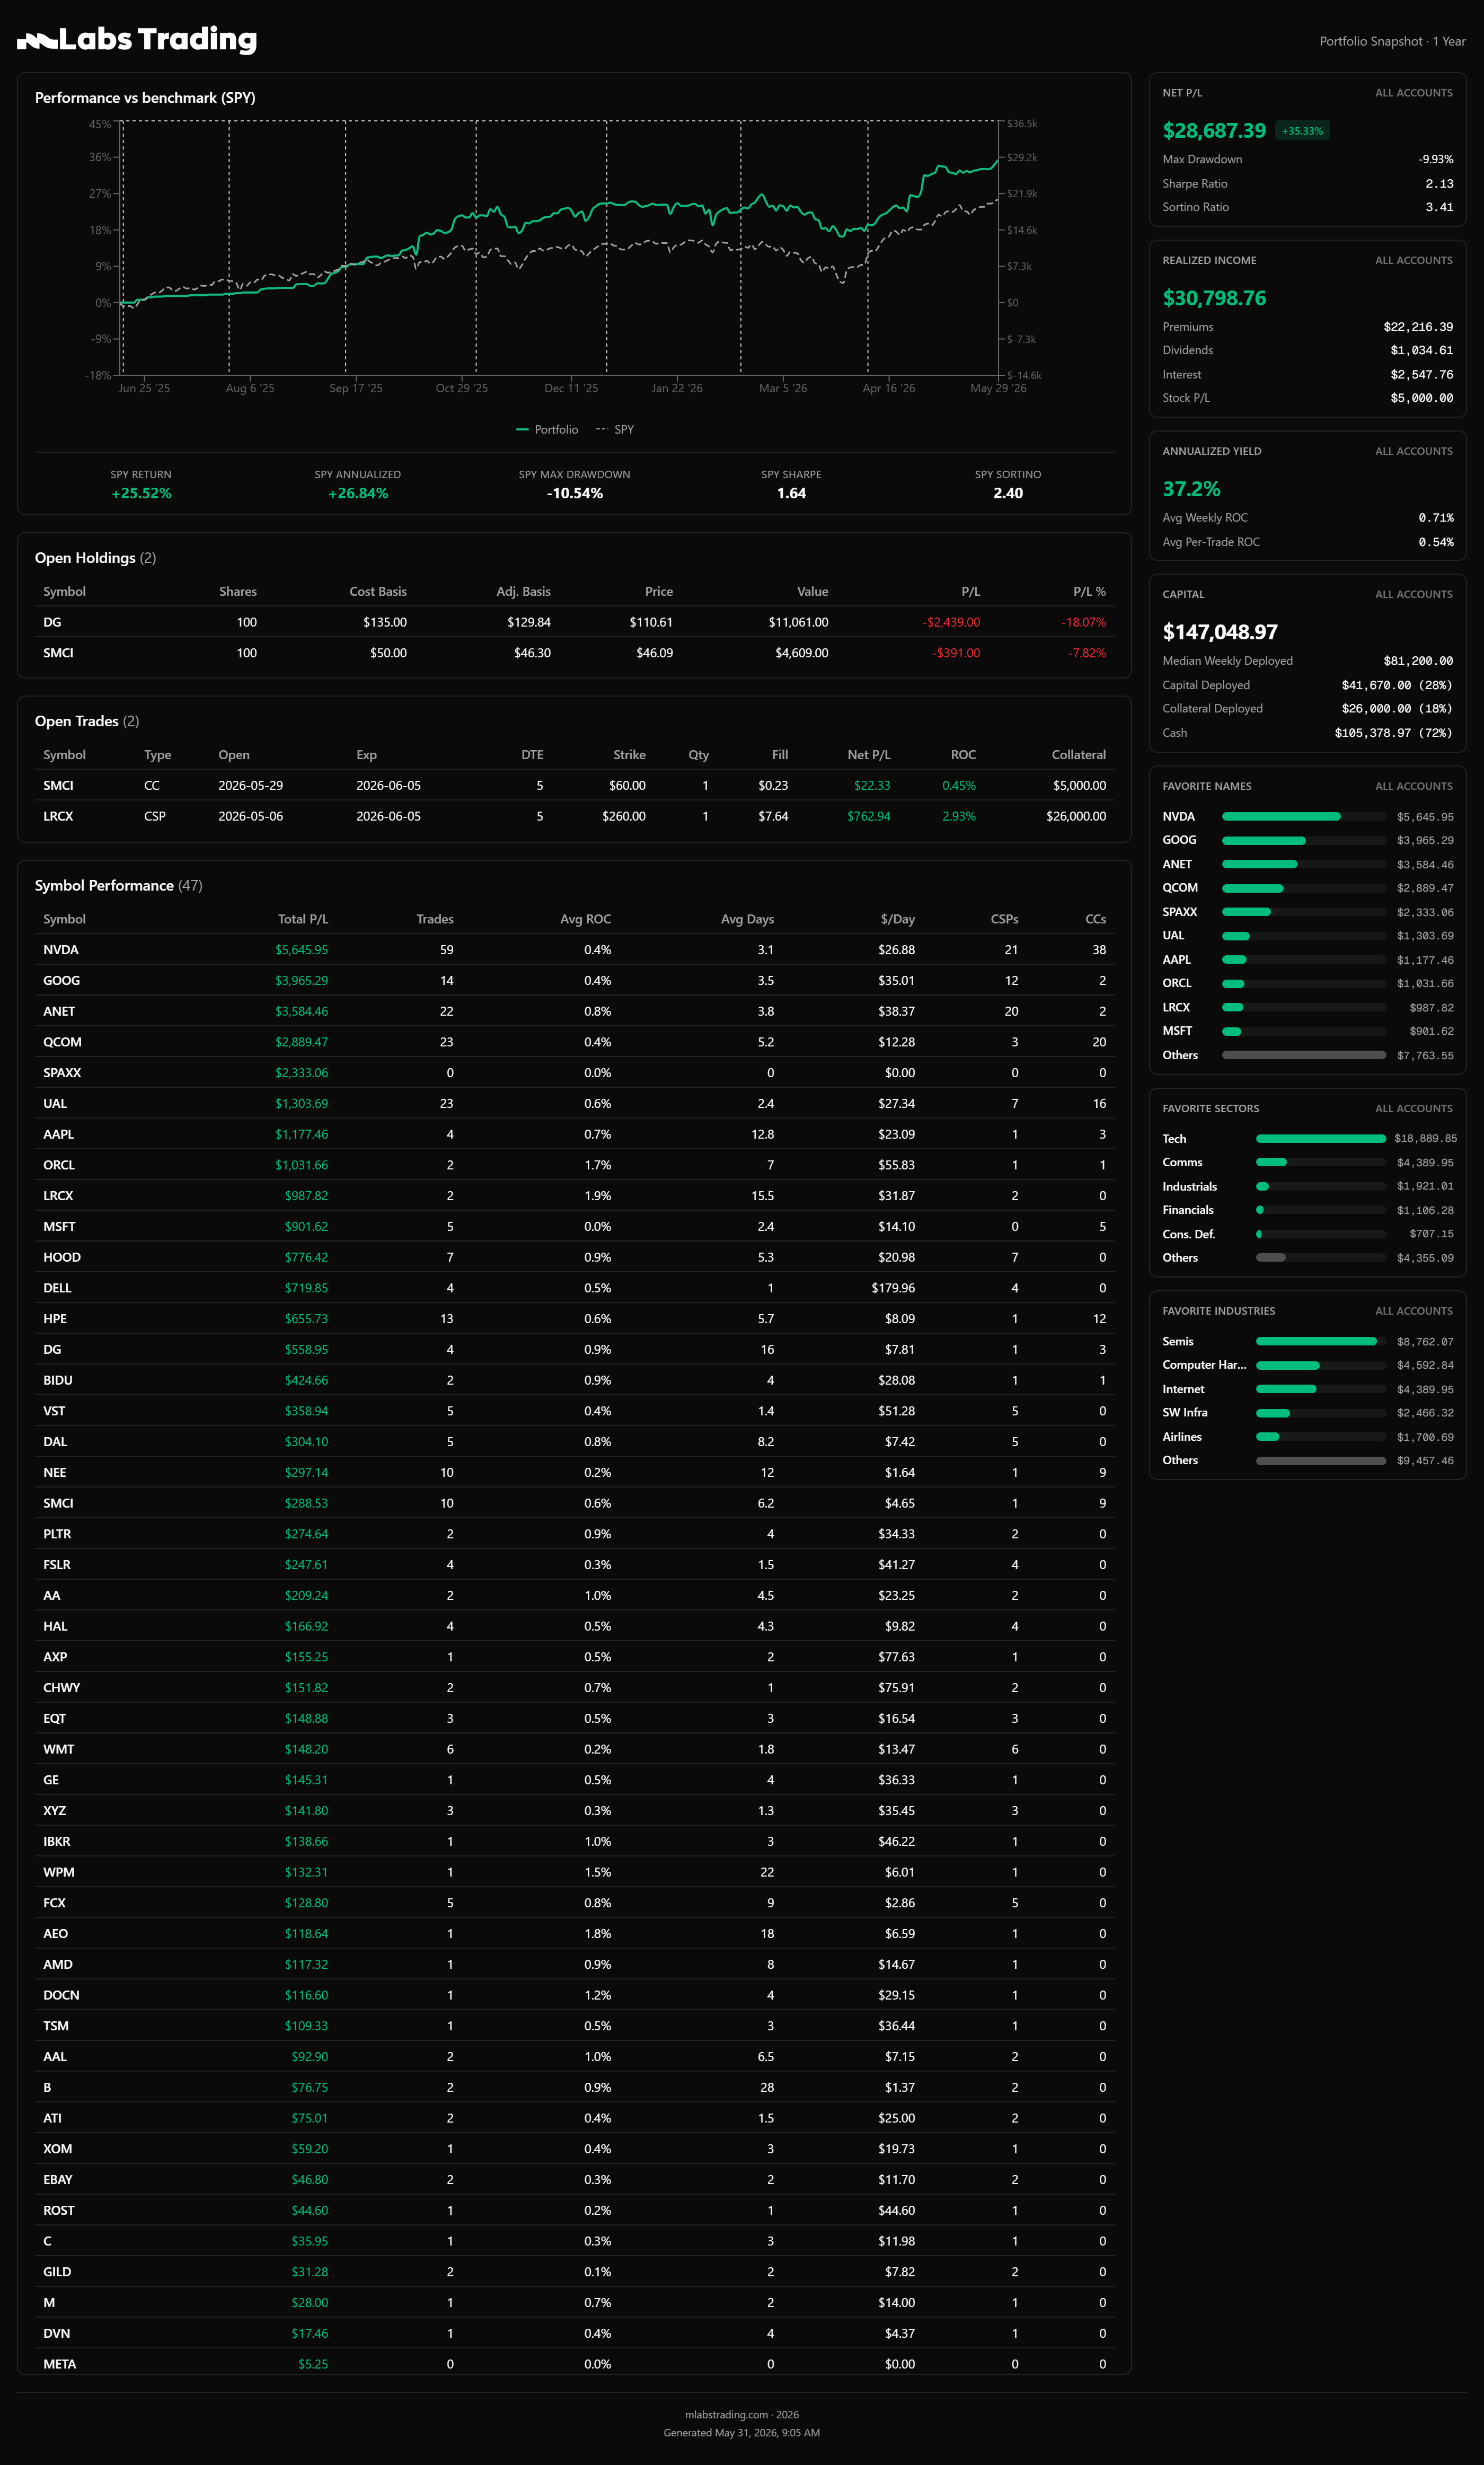
Inception-to-date snapshot (~11 months) — click to enlarge
The wheel isn’t a get-rich-quick strategy. It’s not going to make you 100% in a year. But if you pick the right companies, manage your risk, size your positions correctly, and have the patience to sit through drawdowns and slow weeks, it works.
Five months into 2026, I’m up 11.17% on deployed capital. Max drawdown under 10%. All of that on names like QCOM, NVDA, GOOG, LRCX, DG, and XOM. Not on SOFI, HIMS, or whatever the hot name is this week.
It’s boring on purpose. That’s the whole point.
Every trade is posted in real time on our Discord and the full trade log is downloadable from any of our weekly recaps. If you want to verify anything in this post, the data is there.
Get notified when we publish new trading insights, results, and strategies.
No spam. Unsubscribe at any time.