One Year Wheeling BORING Names. Here's The Full Breakdown.
One year ago, on June 16, 2025, I sold the first cash-secured put under what became BORING PUTS. Twelve months and 273 trades later, the account is up $28,527 in net P/L, or +35.13% on the capital I actually put to work. SPY returned +25.65% over the same stretch. I did it with a max drawdown of -9.93%, and on a typical week only about half the account was ever deployed. The rest sat in cash.
That last part is the whole point. I’m not trying to beat the market on raw returns. I’m generating steady income while keeping a big chunk of my money on the sidelines, earning 4%+ in money market, ready to deploy when everyone else is in shambles. When things eventually get ugly, and they always do, I won’t be fully invested at the top. Go ask the people chasing fat premiums what their max drawdown looked like this year. Single digits? Probably not.
This post is the full breakdown of one year running the wheel. Every number below comes straight from the trade log, which is downloadable at the bottom if you want to verify any of it. Or you can hop into the Discord and see every trade posted in real time.
If you’ve followed along, you already know the drill. I sell cash-secured puts on boring, profitable companies. I get assigned sometimes. When I do, I sell covered calls and collect premium, dividends, and interest while I wait. That’s the entire strategy.
I don’t panic over assignments, because when one happens I’m just holding shares of a good business and usually getting paid to sit on them.
The wheel does not have to be complicated. People dress it up with screeners full of greeks and twenty indicators. Strip all of that away and it’s still the same three steps. The hard part was never the mechanics. It’s picking the right companies and having the patience to do nothing when the regime isn’t favorable.
Here’s the inception-to-date snapshot, June 16, 2025 through June 20, 2026:
| Metric | Value |
|---|---|
| Net P/L | $28,527.69 (+35.13%) |
| Realized Income | $32,616.69 |
| Premiums | $23,972.45 |
| Stock P/L | $5,000.00 |
| Interest | $2,609.63 |
| Dividends | $1,034.61 |
| Total Trades | 273 |
| Unique Tickers | 47 |
| Win Rate | 96.3% |
| Sharpe Ratio | 2.02 |
| Sortino Ratio | 3.23 |
| Max Drawdown | -9.93% |
| Annualized Yield | 35.2% |
| Avg Weekly ROC | 0.68% |
| Avg Per-Trade ROC | 0.55% |
| Median Weekly Deployed | $81,200 |
| Capital Deployed | $14,411 (10%) |
| Current Cash | $132,478 (90%) |
| Total Capital | $146,889 |
| SPY Return | +25.65% |
| SPY Annualized | +25.72% |
| SPY Max Drawdown | -10.69% |
| SPY Sharpe | 1.46 |
| SPY Sortino | 2.08 |
The number I care about most is the Sharpe of 2.02 over a full year. That tells you the returns aren’t coming from a couple of lucky trades or wild swings. The strategy returned more than SPY (+35.13% on deployed vs +25.65%), with a higher Sharpe (2.02 vs 1.46), a higher Sortino (3.23 vs 2.08), and a shallower drawdown (-9.93% vs -10.69%). That’s the definition of having an edge.
A full year of trading through a war or two, oil spikes, tariff headlines, the QCOM saga, and a brutal semis rout in June, and the worst the account ever drew down was -9.93%. The S&P itself drew down more than that over the same year.
The deepest hole I sat in all year was QCOM. I got assigned at $167.50 and $160, watched it grind down to $124, and stared at roughly $7,900 in unrealized losses before wheeling out with about $2,900 in profit a few months later. I wrote the entire trade up here. It was the hardest stretch of the year and also the best proof the strategy works. I held because the business wasn’t trash. The price was down, the company was not. Those are two different things, and knowing the difference is what lets you sit through the red instead of panic-selling the bottom like most retail traders.
The reason a name like QCOM could fall that hard and the account still only drew down single digits is sizing. No single position was ever big enough to matter on its own. Even on the busiest weeks the capital was spread across a handful of names, never piled into one. QCOM was painful, but it was one modest slice of the entire portfolio, never a make-or-break bet.
The same logic applies to sectors and industries. A wheel account stuffed full of semis or high-beta tech might look diversified by ticker, but it’s not diversified by risk. When that group rolls over, every position rolls over together. So I spread across sectors instead of stacking one theme.
And past individual positions entirely, I keep a big cash position. On a typical week only about half the account was deployed, the rest sitting in money market earning interest, which added up to $3,643 over the year just for waiting. Right now I’m at 90% cash with no open trades. That cushion is what lets me sit tight when a position moves against me and add when everyone else is getting forced out.
Here are the top names by P/L over the year. The majority of these aren’t speculative, and didn’t generate exciting premium:
| Ticker | Net P/L | Trades |
|---|---|---|
| NVDA | $5,645.95 | 59 |
| GOOG | $4,172.23 | 15 |
| ANET | $3,584.46 | 22 |
| QCOM | $2,889.47 | 23 |
| UAL | $1,303.69 | 23 |
| AAPL | $1,177.46 | 4 |
| ORCL | $1,031.66 | 2 |
| LRCX | $987.82 | 2 |
| MSFT | $901.62 | 5 |
| HOOD | $776.42 | 7 |
| DELL | $719.85 | 4 |
| HPE | $655.73 | 13 |
NVDA was the workhorse, mostly covered call management on assigned shares plus a steady stream of puts. QCOM did most of its damage during the wheel that finally completed in late April, when it ripped through my strikes and got called away above cost on both lots after months of grinding. GOOG, ANET, LRCX, ORCL, and the rest are the same kind of name. Companies that recover when they dip and pay you while you wait. There’s no SOFI, no HIMS, no MARA, IONQ, TSLL, etc on this list. That’s on purpose.
Look at the activity by month. The trade count tells the discipline story better than anything I could write:
| Month | Trades | Premium |
|---|---|---|
| Jun 2025 (from 6/16) | 4 | $1,189 |
| Jul 2025 | 5 | $589 |
| Aug 2025 | 13 | $1,630 |
| Sep 2025 | 39 | $4,470 |
| Oct 2025 | 39 | $4,958 |
| Nov 2025 | 29 | $1,938 |
| Dec 2025 | 33 | $1,493 |
| Jan 2026 | 43 | $2,099 |
| Feb 2026 | 13 | $1,575 |
| Mar 2026 | 27 | $489 |
| Apr 2026 | 13 | $1,046 |
| May 2026 | 10 | $1,526 |
| Jun 2026 (through 6/16) | 5 | $1,037 |
September, October, and January were busy because the market was cooperating and there was real premium to sell. February, May, and June I pulled way back and did almost nothing, sometimes a handful of trades in an entire month. When breadth is bad or premium is not worth the risk, I sit on my hands. The hardest part of selling premium (or trading in general) isn’t picking the strike. It’s knowing when not to sell (or trade) at all, and being fine watching weeks go by with the account mostly in cash.
Every week I see someone ask what to sell puts on, and the top answers are always whatever X and the theta-based subs are pumping… Usually the premium juicers - SOFI, HIMS, MARA, RIOT, IONQ, etc take your pick. Those names throw off fat premium, but the premium is fat for a reason. The market is telling you the thing could move 15% in a day, 20%+ in a week, and when it does you’re stuck holding shares of a company that might not even be profitable.
The people wheeling high-beta junk collected big premium in January and then spent the next several months bagholding through 30 to 40% drawdowns on names that don’t bounce back the way a BORING mega cap name does. Meanwhile my trade log is full of companies that recover, pay dividends while you wait, and let the wheel actually do its job because the business isn’t broken when the stock is down.
It’s boring on purpose. Boring is what helped keep my drawdowns in single digits.
Every single trade in that log was posted to mLabs Trading members the moment it was filled. Not summarized after the fact, not cherry-picked, not screenshotted only when it worked out. Real time, as it happened, winners and the handful of losers alike. The full year is downloadable below so anyone can check the timestamps against the numbers.
The tools I use to run this are the same ones members get. The screening that surfaces these names, the contract scoring I lean on to pick strikes and expiries, and the nightly watchlists all come from the platform I built to run my own wheel. It’s not a black box and it isn’t complicated. It just does the boring work of finding decent setups on solid companies so the decision at the end is simple.
As of June 20, one year in:
DG and SMCI are both underwater right now, and that’s fine. They’re being wheeled the same way QCOM was, with covered calls and patience, and I’ll keep grinding the cost basis down until they come back. That’s the strategy working exactly as designed, not breaking.
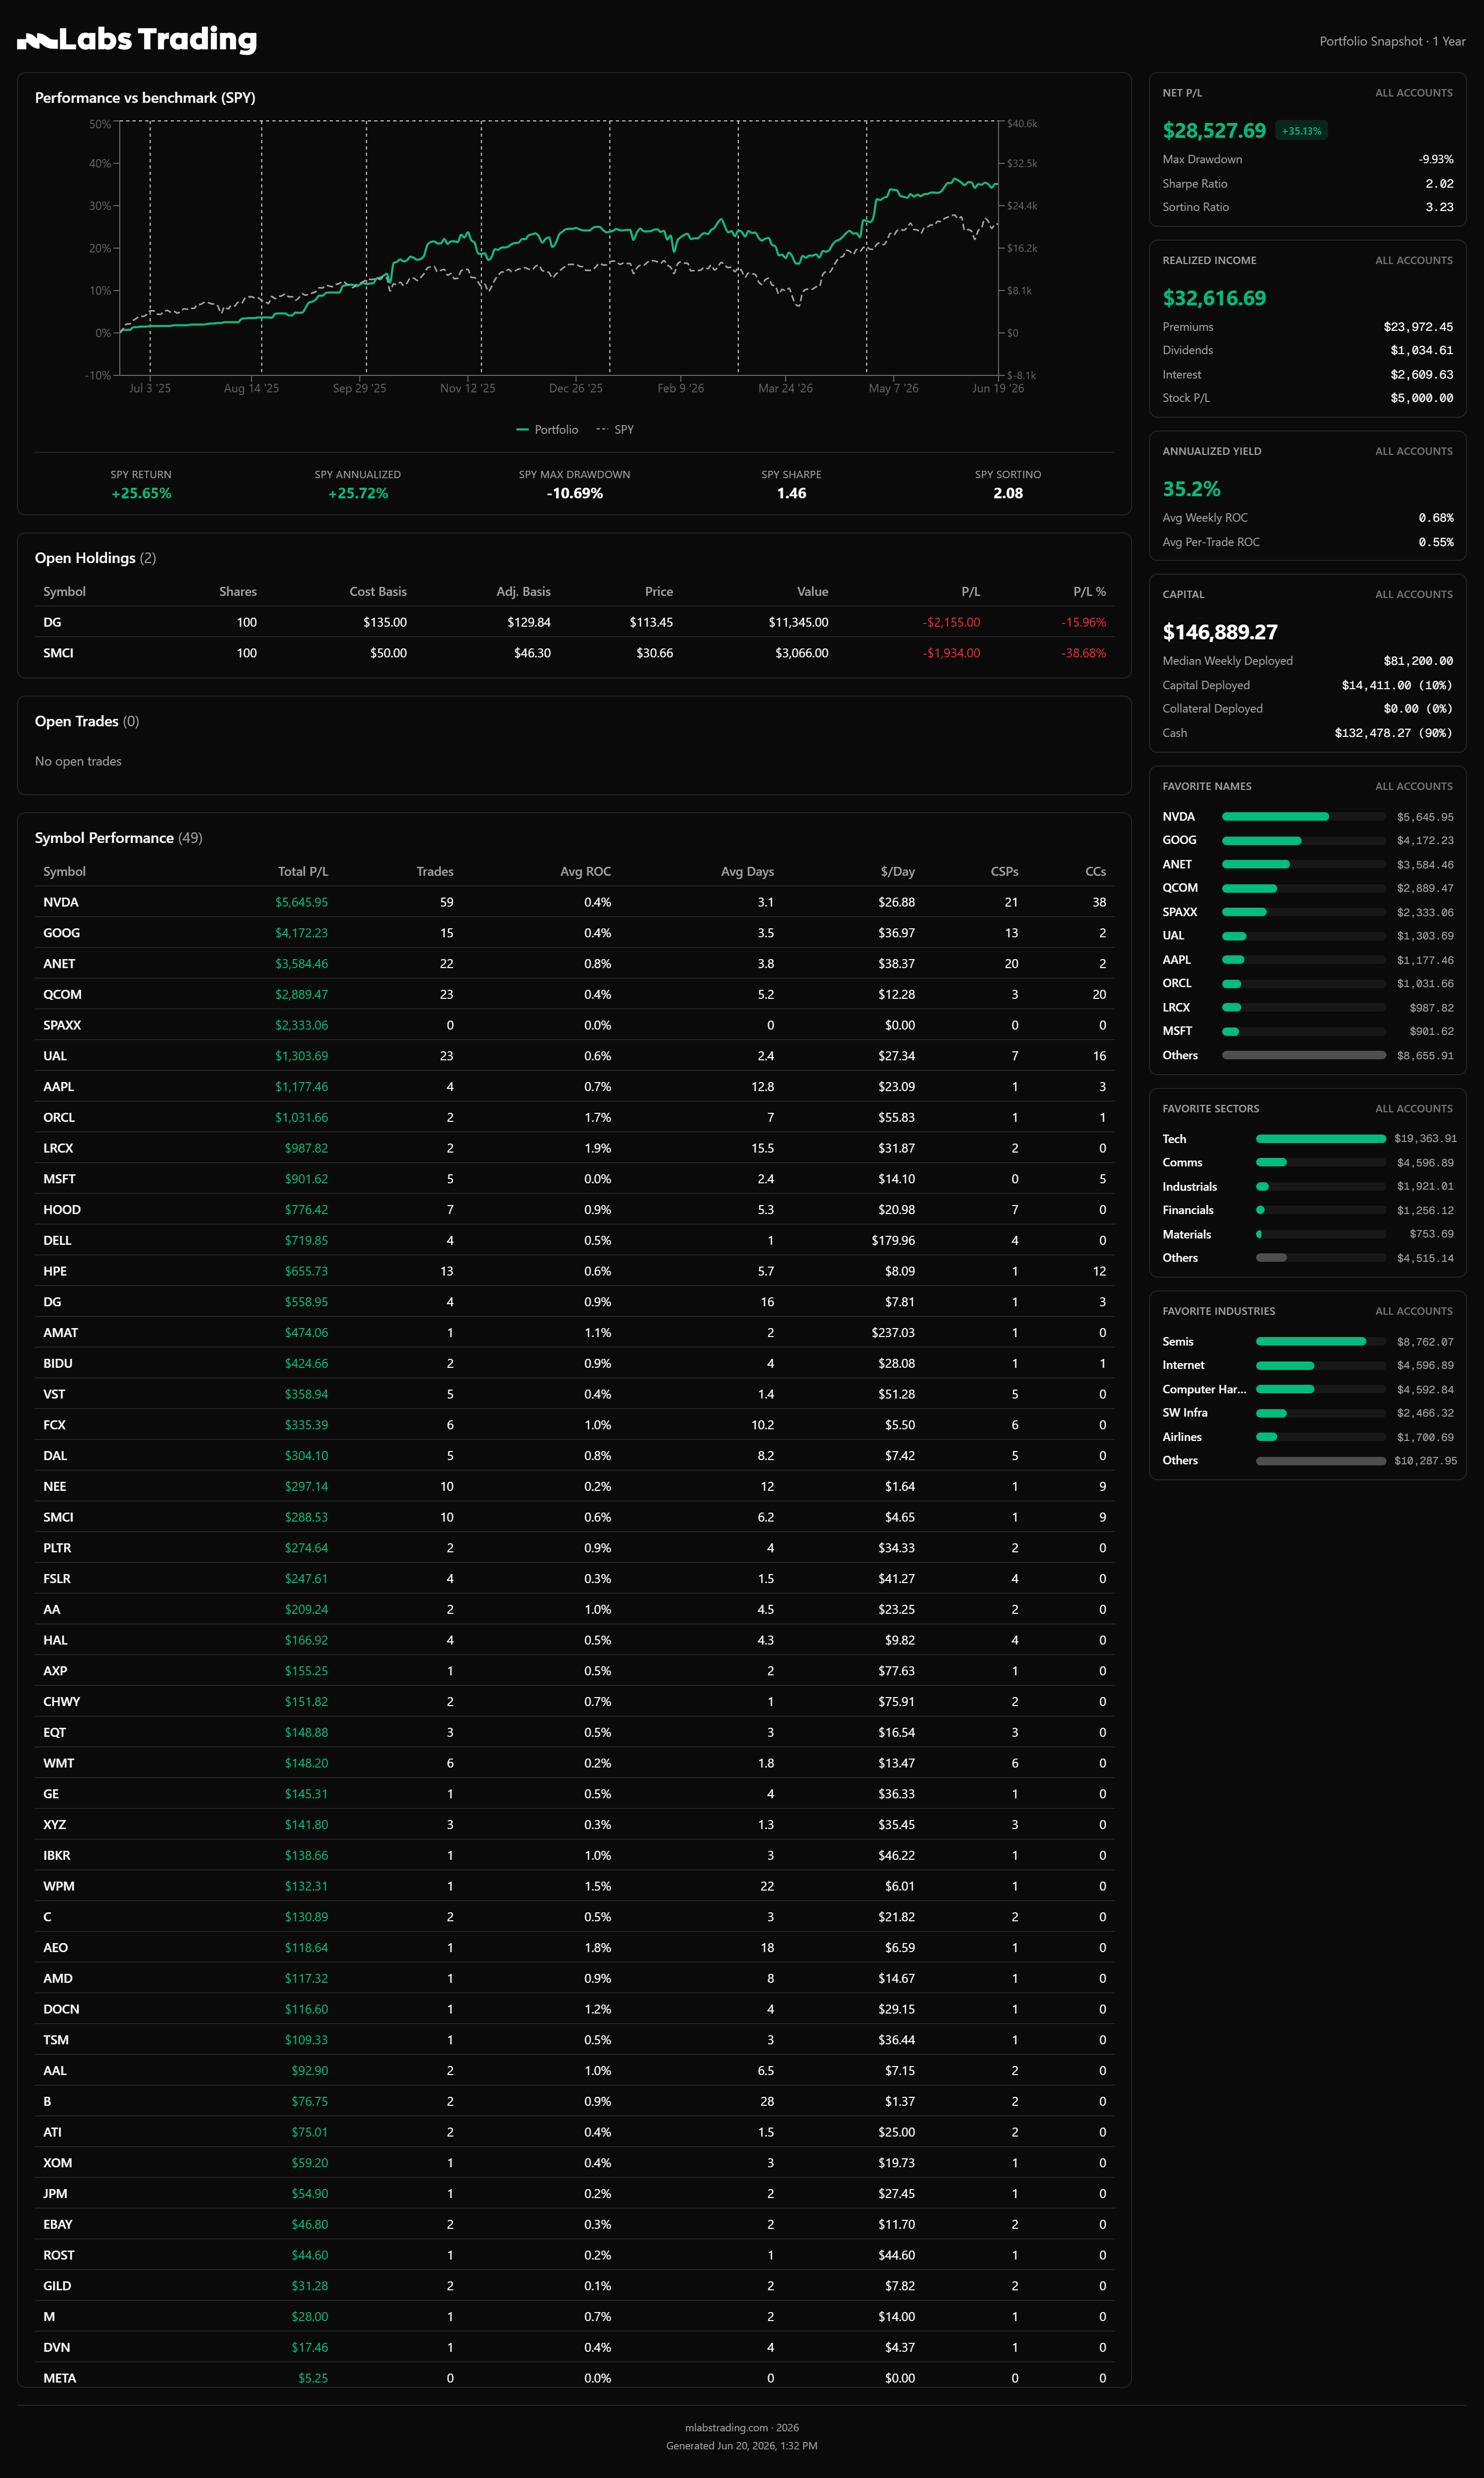
One-year snapshot since inception, June 16, 2025 through June 20, 2026. Click to enlarge.
The wheel is not going to make you 100% in a year. That was never the goal. But if you pick the right companies, size your positions so no single one can hurt you, and have the patience to sit through drawdowns and dead weeks, it does exactly what it’s supposed to. A full year in, I’m up +35.13% on deployed capital, ahead of SPY, with a max drawdown under 10% and, on average, about half the account in cash.
That’s the case for boring. Better risk-adjusted returns, a shallower drawdown than the index, and a strategy simple enough to run for the rest of your life. Year two starts the same way year one did. One boring put at a time.
Every trade is posted in real time for mLabs Trading members, and the full year is below if you want to verify anything in this post. The data is all there.
Get notified when we publish new trading insights, results, and strategies.
No spam. Unsubscribe at any time.